

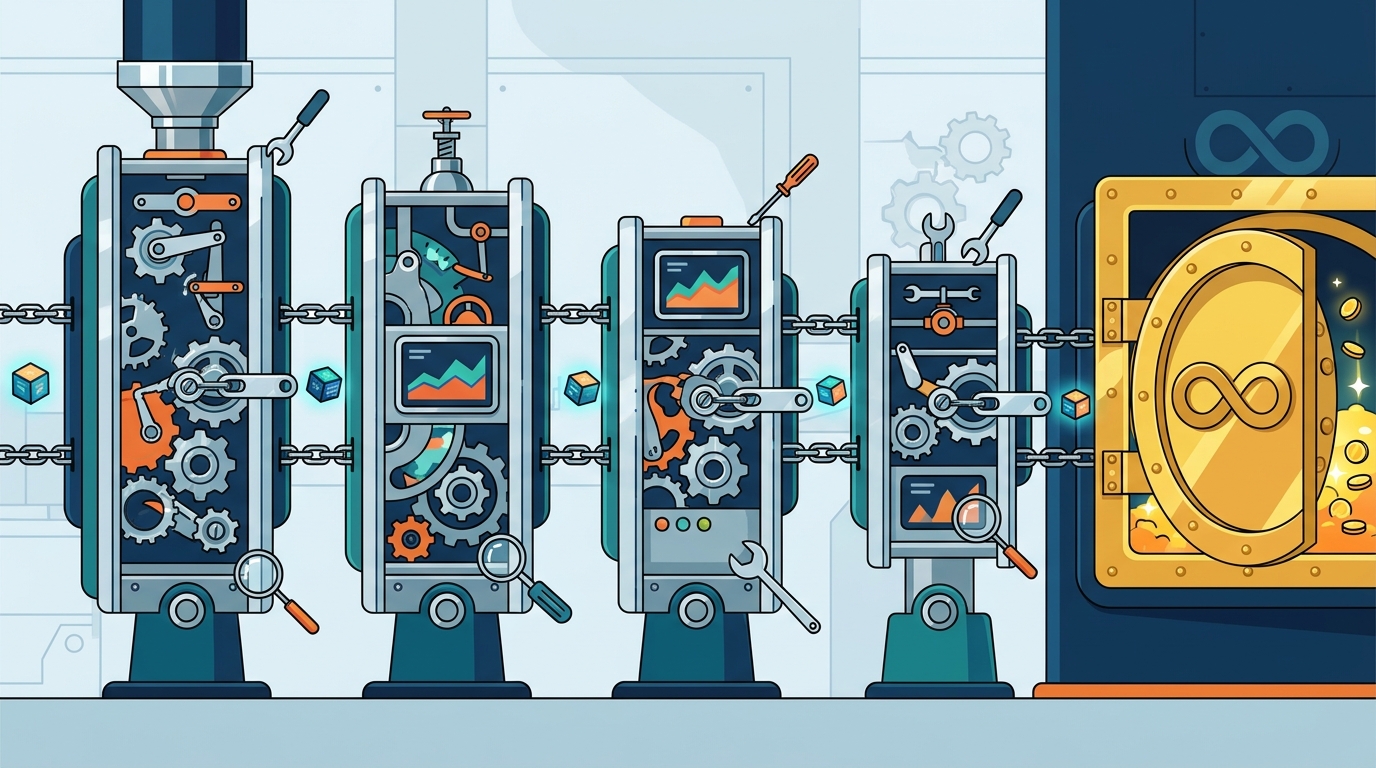
Your marketing funnel is not one metric — it is a chain of handoffs, and every weak link quietly bleeds revenue. Instead of hunting for a single silver-bullet fix, the most effective approach is to diagnose and improve each stage independently so that small gains compound into outsized results. This playbook from Infinity Media walks you through exactly how to do that.
Why Stage-Level Thinking Beats Top-Line Metrics
Many businesses track a single overall conversion rate and call it a day. The problem is that an aggregate number hides the real story. A funnel converting at 3 percent overall could have a stellar landing page and a catastrophic lead-nurturing sequence — or vice versa.
Stage-level analysis lets you pinpoint exactly where prospects stall. As conversion-rate research confirms, even a small drop in performance at one step can drag down the entire sales funnel. The fix is to treat each transition as its own optimization project.
A useful mental model: a 5-percentage-point lift at every stage can double your end-to-end conversion rate. That is the compounding effect of stage-by-stage thinking.
Benchmarks You Should Actually Use
Before you optimize, you need context. Industry data gives you a starting line — not a finish line.
| Funnel Transition | Average Range | Source Context |
|---|---|---|
| Visitor → Lead | 1 – 5 % | Varies by traffic quality and landing-page relevance |
| Lead → MQL | 25 – 35 % | Depends on lead-scoring criteria |
| MQL → SQL | 13 – 26 % | Highest leak point in most B2B funnels |
| SQL → Opportunity | 50 – 62 % | Qualified leads entering real pipeline |
| Opportunity → Closed-Won | 15 – 30 % | Deal complexity and sales skill dependent |
These ranges draw on VWO and First Page Sage benchmark reports covering multiple industries. Use them diagnostically: if any stage falls well below the range, that is where you investigate first.
Step 1 — Fix the Top of the Funnel (TOFU)
Understand the Buyer Mindset
Nearly 96 percent of visitors arriving on a website are not ready to make a purchase. Your job at the top is not to sell — it is to earn the right to continue the conversation. That means educational content, not product pitches.
Prioritize Organic Search
SEO-generated leads achieve a 51 percent MQL-to-SQL conversion rate versus 26 percent for PPC. Organic traffic also produces 2.5 times more sales-qualified leads per visitor. Despite this, most B2B companies still spend more on paid than organic — a misallocation that directly weakens funnel quality downstream.
Speed Is a Conversion Lever
Page load time has a measurable impact on funnel progression. Web pages that load within one second convert at 2.5 times the rate of pages that load in five seconds. Every additional second of delay costs you real revenue. Run Google PageSpeed Insights on every landing page and address the top three recommendations.
Practical Moves
- Publish long-form, intent-matched blog content (blog posts improve TOFU traffic by 55 percent on average).
- Create downloadable lead magnets — free resources convert 28 percent higher than newsletter sign-ups alone.
- Add social proof to opt-in pages; testimonials and logos lift sign-ups by 14 – 22 percent.
- Remove unnecessary navigation links from landing pages, which can increase sign-ups by 20 – 45 percent.
Step 2 — Tighten the Middle of the Funnel (MOFU)
The MQL-to-SQL Gap Is Where Funnels Die
The marketing-to-sales handoff is the single most common failure point. A 13 percent average MQL-to-SQL rate means marketing is handing over leads that sales cannot close — usually a symptom of misaligned MQL definitions rather than a traffic quality problem. The fix is rebuilding MQL criteria jointly with sales and adding behavioral signals to scoring.
Nurture or Lose Them
Research shows that 79 percent of leads never convert due to a lack of proper nurturing. Meanwhile, companies that excel at lead nurturing generate 50 percent more sales-ready leads at 33 percent lower cost. The return on a well-built drip sequence is enormous.
Practical Moves
- Build behavior-triggered email sequences. Lead-nurturing emails generate an 8 percent click-through rate versus 3 percent for general sends — roughly 2.6 times more effective.
- Use mid-funnel video content. Personalized video in nurture flows can boost conversion rates by up to 79 percent over text-only equivalents.
- Respond to qualified leads within one hour. Speed is the difference between a 53 percent contact rate and a 17 percent one.
- Ensure buyers see 3 – 5 pieces of content before a sales conversation — that is the cadence most B2B buyers prefer.
Step 3 — Reduce Friction at the Bottom of the Funnel (BOFU)
Simplify the Decision
Even small points of friction can delay purchases or cause prospects to reconsider. At this stage your goal is to strengthen confidence and remove anything that slows a qualified buyer.
Personalize Everything
Personalized calls to action convert 202 percent better than generic ones, making personalization the single highest-impact element available to most marketers at the decision stage. If your CTA still reads "Submit" or "Learn More," you are leaving conversions on the table.
Practical Moves
- Add trust badges to checkout or proposal pages — this can increase completion rates by 12 percent.
- Simplify forms: reducing fields from seven to three increases sign-ups by 42 percent.
- Remove unnecessary payment friction, which can improve close rates by 16 – 33 percent.
- Deploy exit-intent pop-ups to recover 3 – 6 percent of abandoning visitors.
- Add live chat assistance. Adding live chat to a landing page increases sales by 20 percent on average.
Step 4 — Extend the Funnel Past the Sale
The best-performing funnels do not end at "closed-won." Retention and expansion are where long-term economics play out, especially for service businesses and SaaS companies.
- Track Net Revenue Retention. The median across B2B SaaS is 106 percent; top performers exceed 120 percent.
- Invest in backend upsells — funnels with post-purchase offers increase total revenue by 30 – 70 percent.
- Measure return visits and repeat purchases as indicators of long-term business health.
Tools and Tactics That Multiply Results
A/B Testing
A/B testing landing pages improves conversions by 10 – 37 percent. In 2026, AI is elevating this from manual experiments to continuous optimization through automated test design, dynamic traffic allocation, and real-time significance monitoring.
CRO Investment
Structured conversion-rate optimization programs deliver an average ROI of 223 percent — every dollar invested generates more than three dollars in revenue. Yet the industry spends just one dollar on conversion for every 92 dollars spent on traffic acquisition, representing a massive under-investment.
AI-Driven Lead Scoring
AI scoring increases qualified-lead accuracy by 29 – 44 percent. When combined with CRM behavioral data and real-time intent signals, organizations report significantly higher lead-to-customer conversion rates.
Copy Clarity
Pages with high-intent copy written at a 5th-to-7th-grade reading level achieve 11.1 percent conversion rates compared to 5.3 percent for college-level copy — a 56 percent improvement just from making language more accessible.
Key Takeaways
- Diagnose by stage, not in aggregate. Each funnel transition has its own benchmark range. Track them independently to find the real bottleneck.
- Invest in nurturing. Nearly 80 percent of leads fail because they are not nurtured. Automated drip sequences are the highest-ROI mid-funnel tactic.
- Speed matters everywhere. Page speed, lead-response time, and sales-cycle velocity all correlate directly with conversion rates.
- Personalize relentlessly. From CTAs to email subject lines to video content, personalization consistently delivers triple-digit performance lifts.
- Spend on conversion, not just traffic. CRO investment returns 223 percent on average, yet most companies dramatically under-invest in it.
Frequently Asked Questions
What is a good overall marketing funnel conversion rate?
Most funnels convert between 3 and 10 percent from top to bottom. B2B funnels typically land between 1 and 5 percent due to longer buying cycles, while B2C funnels often reach 5 to 15 percent. The overall number matters less than your stage-by-stage performance.
Where do most leads drop off in a marketing funnel?
The awareness stage loses approximately 79 percent of leads, and the interest stage drops another 50 percent. These are the two highest-volume loss points. In the B2B world, the MQL-to-SQL handoff is the most common structural leak.
How often should I optimize my marketing funnel?
Companies that optimize funnels quarterly see 10 – 30 percent revenue growth. Monthly optimization can drive 15 – 50 percent year-over-year gains. At a minimum, review stage-level metrics every quarter and run A/B tests continuously.
Does page speed really affect funnel conversions?
Yes. Pages that load within one second convert at 2.5 times the rate of five-second pages. Every additional one-second delay reduces conversions by approximately 7 percent.
What is the most cost-effective funnel optimization tactic?
Structured CRO programs return an average of 223 percent ROI. Specific high-impact moves include simplifying forms (42 percent more sign-ups), personalizing CTAs (202 percent better conversion), and adding video to landing pages (86 percent higher conversion).
How can Infinity Media help with funnel optimization?
Infinity Media partners with growth-focused businesses to audit every funnel stage, identify drop-off points with data, and implement tailored strategies — from SEO-driven TOFU content to AI-assisted lead scoring and personalized nurture sequences. Get in touch to discuss your funnel.